
Help is a call away: +44 1204 452000


Select a florist
Select a preferred florist to full fill your order and find out more details
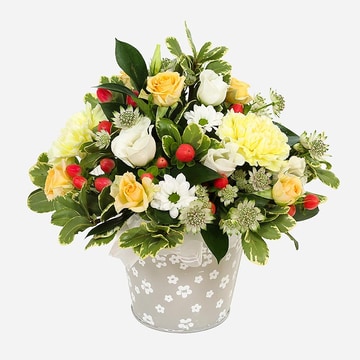
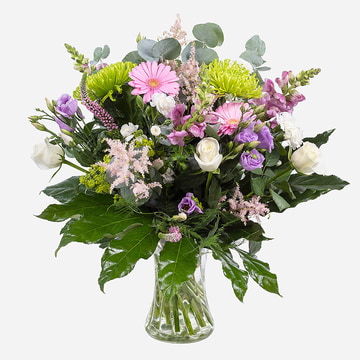
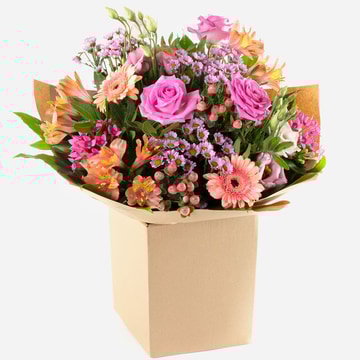
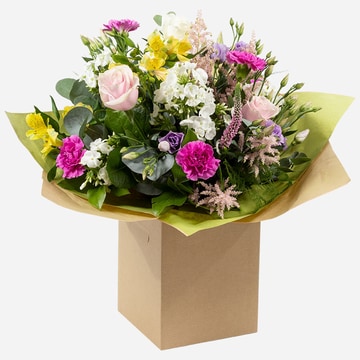
Florist-Made Bouquets, Delivered by Trusted Courier
Select flowers:
Filters

0 Selected
Clear all
 Delivery address
Change currency
Select currency
£ GBP
Need it today? Order within

Back
£ GBP
Pound Sterling
€ EUR
Euro
$ USD
United States dollar
$ AUD
Australian dollar
$ NZD
New Zealand dollar
$ CAD
Canadian dollar
Back

UK

Ireland

Australia

New Zealand

Belgium

Brazil

Canada

Cyprus

Czech Republic

Germany

Greece

Italy

Malta

Netherlands

Poland

Portugal

South Africa

Spain

Switzerland

Turkey

USA

United Arab Emirates
was added to your basket
London
Manchester
Glasgow
Edinburgh
Sheffield
Birmingham
Jersey
Liverpool
Bolton
Bournemouth
Help is a call away: +44 1204 452000
Same Day Flower Delivery by Local Florists
Floristry Service Provider of the Year 2024
100% Secure Online Ordering